|
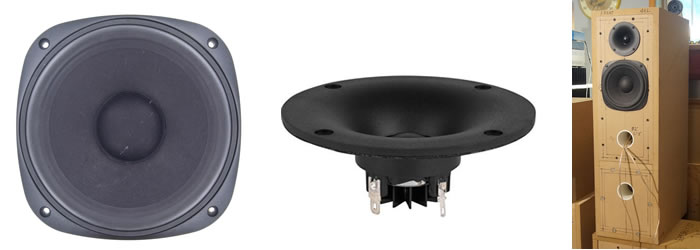
Lark DCR2b
Dual Chamber Reflex
SB Acoustics SB16PFC25-8 with Dayton ND25FW-4
All it took was two days before I ripped apart the Lark-DCR2 crossover. I just couldn’t stomach the sound anymore. Yes, it measures well. The trouble is there’s no life in the music. Dull is the word.
This time round, I threw caution to the wind. No trying to save cost on crossover. Go for the music. As before, the key is the Dayton ND25FW-4 tweeter. I decided to take her to her limits and see what happens.
 Fig 1 – Black plot = RAW. Red plot = 12dB/oct. Fig 1 – Black plot = RAW. Red plot = 12dB/oct.
The Red plot in Fig 1 is the new crossover response of the ND25FW-4. This is the first time I am crossing a HiFi tweeter at 1.4kHz. Most of the time, it doesn’t work. I would have to resort to a compression driver to cross this low.
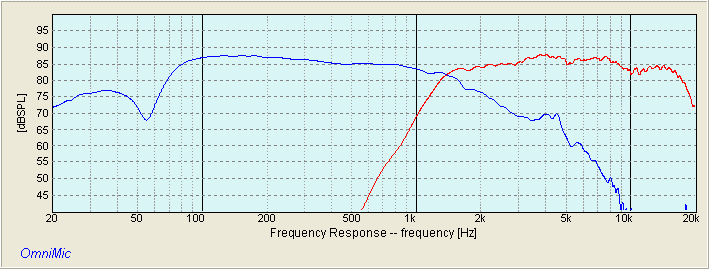
Fig 2 – Blue plot = SB16PFC25-8. Red plot = ND25FW-4
Measurements below 500Hz are in Nearfield.
Fig 2 shows the response of the SB Acoustics SB16PFC25-8 with a new 12dB/oct Low Pass filter (Blue plot). Acoustically, the two drivers are crossing at 1.4kHz.
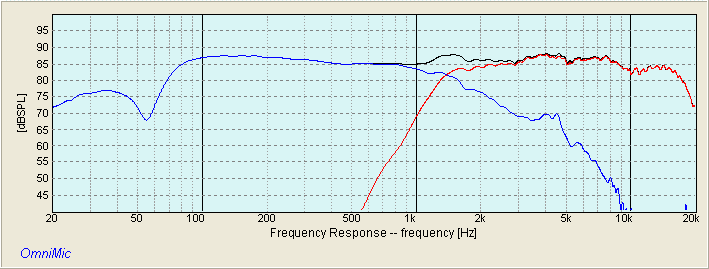
Fig 3 – Summed Response with ND25FW-4 wired in Absolute Phase
The Black plot in Fig 3 is the summed response of the SB16PFC25-8 and the ND25FW-4 with their new crossovers.
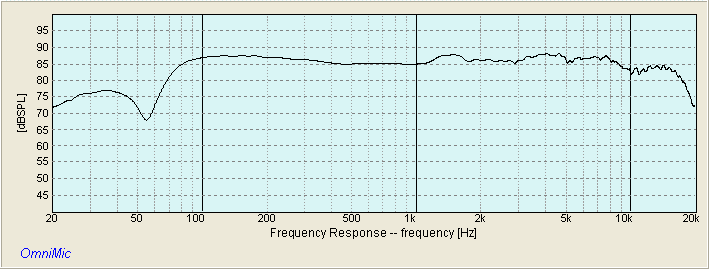 Fig 4 – Lark-DCR2b Frequency Response. Measurements below 500Hz are in Nearfield. Fig 4 – Lark-DCR2b Frequency Response. Measurements below 500Hz are in Nearfield.
The final frequency response of the Lark-DCR2b is in Fig 4. As before, the response is remarkably flat. The difference is it doesn’t sound like the DCR2 at all.
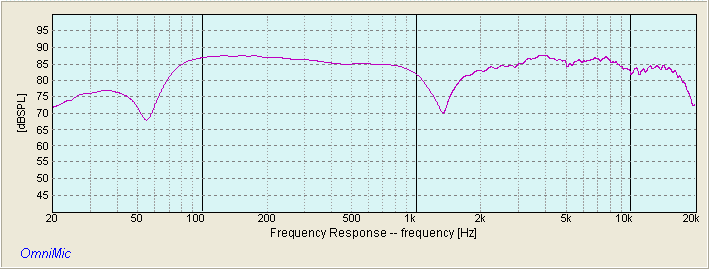 Fig 5 – Null response. Dayton ND25FW-4 wired in Reversed Phase. Fig 5 – Null response. Dayton ND25FW-4 wired in Reversed Phase.
Fig 5 shows the Dayton ND25FW-4 tweeter wired in Reversed Phase. This time, a null is recorded at 1.4kHz. From this, it is evident that I shifted the crossover frequency from 2.5kHz to 1.4kHz.
 Fig 6 – Lark-DCR2b Step Response Fig 6 – Lark-DCR2b Step Response
The Step Response in Fig 6 is slightly different to the previous Lark DCR2.
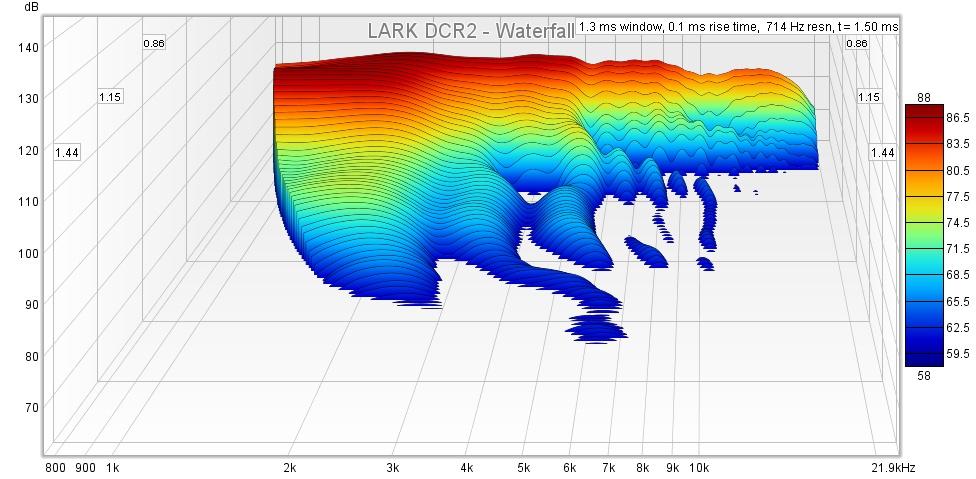 Fig 7 – Lark-DCR2b Waterfall Fig 7 – Lark-DCR2b Waterfall
There’s not much difference in the waterfall plot between the DCR2 and DCR2b (Fig 7).
 Fig 8 – Lark-DCR2b Toneburst Energy Storage Fig 8 – Lark-DCR2b Toneburst Energy Storage
Likewise for the Toneburst Energy Storage plot.(Fig 8). It looks exactly like the previous version.
 Fig 9 – Lark-DCR2b Spectrogram Fig 9 – Lark-DCR2b Spectrogram
It is in the spectrogram (Fig 9) that we see some changes. At the 4 msec mark, the previous version had a yellow patch whereas now it’s all green.
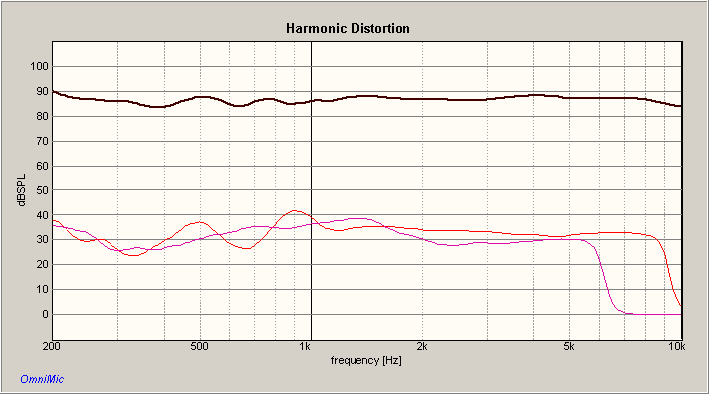 Fig 10 – Red plot = 2nd Harmonic. Violet plot = 3rd Harmonic. Fig 10 – Red plot = 2nd Harmonic. Violet plot = 3rd Harmonic.
The harmonic distortion plot also shows some improvement, namely at 1.4kHz. In the previous DCR2, there is a 3rd harmonic peak whereas in the DCR2b, it is reduced considerably.
Sound of Lark-DCR2b
The Lark DCR2b is everything the Lark-DCR2 is not. Now, the speaker sings. This is what a speaker should sound like. Intimate. Emotional. Straight to your heart. This is the kind of sound that I strive for.
It only goes to show that measurements are pretty meaningless. One needs to listen. Both the DCR2 and DCR2b measure equally well. The first one is bland. The DCR2b sounds wonderful.
If you plan on building A Dual Chamber Reflex, I strongly recommend this Lark DCR2b.
Note: Unless otherwise stated, all measurements were made with the mic at 36 ins, tweeter axis. Impulse Window=5ms. No smoothing applied. |